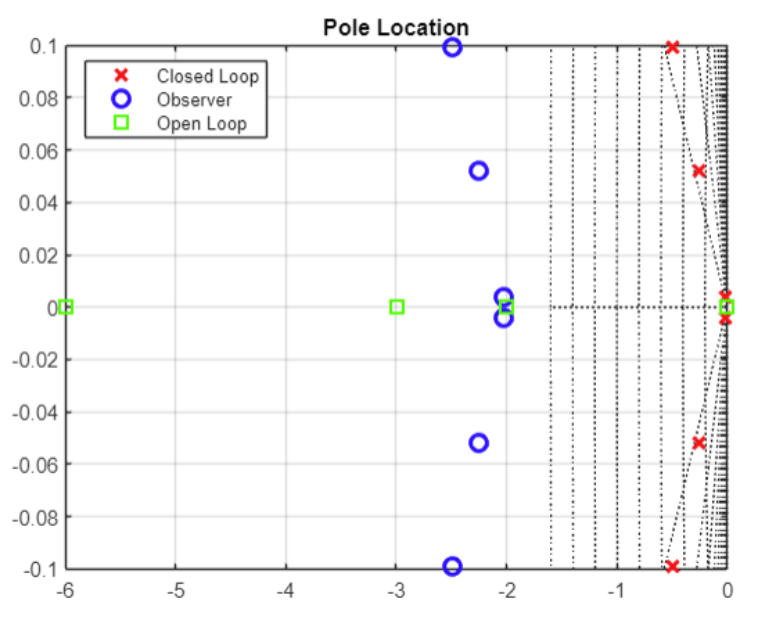
figure;
hold on;


sgrid;

p1 = plot(real(cl_poles), imag(cl_poles), 'rx', 'MarkerSize', 8, 'LineWidth', 2, 'DisplayName', 'Closed Loop');

p2 = plot(real(obsv_pole), imag(obsv_pole), 'bo', 'MarkerSize', 8, 'LineWidth', 2, 'DisplayName', 'Observer');

p3 = plot(real(ol_poles), imag(ol_poles), 'gs', 'MarkerSize', 8, 'LineWidth', 2, 'DisplayName', 'Open Loop');

% Explicitly controlling the legend to only include desired plots

legend([p1, p2, p3], 'Location', 'best');

title('Pole Location');

hold off;

grid on